Okay, I’m scared of change just like everyone else. I have been building Visios for a pretty long time and know where all the menus are so I’m pretty fast with it. But I do use a Macbook when I travel and firing up Fusion just to run Visio is frustrating. I thought since it’s a new year I should try Lucidchart and see what I though. Now I’m still kind of fond of Visio, but the Integrations feature with Lucidchart on top of the web interface allowing me to use it anywhere, is enough to make me drop Visio for the long haul.
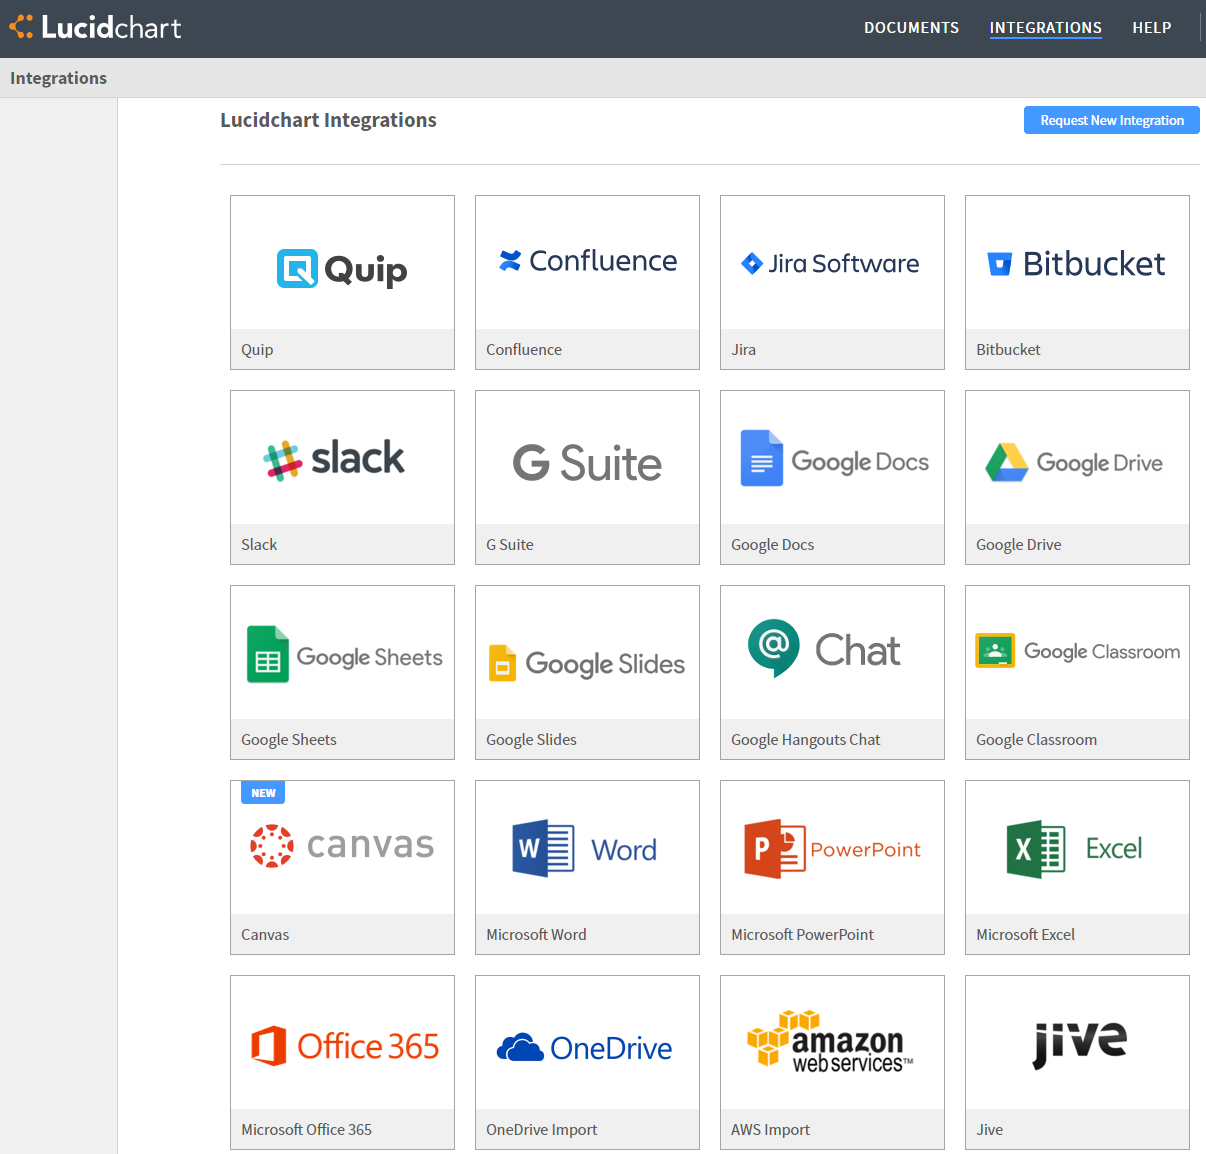
So what are integrations? Well as you might guess its a way for a third party to use Lucidchart to build diagrams. The example that I’ll show in this post is using the Amazon Web Services integration to automatically build a diagram of my environment but there are a whole list of integrations available for you to utilize. Simple go to the Integrations link in your Lucidchart account, select and install the integration you’re interested in and you’re ready to get started.
AWS Integration Example
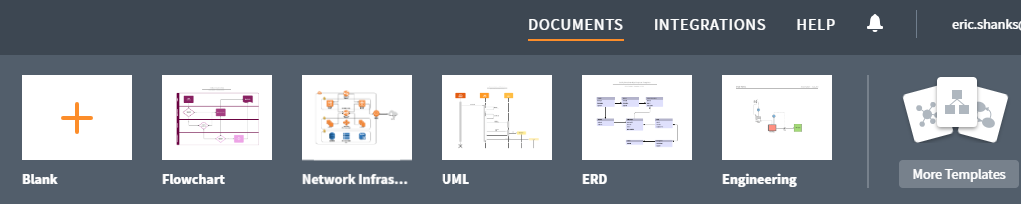
To get started create a new diagram from the “More Templates” option in Lucidchart account.
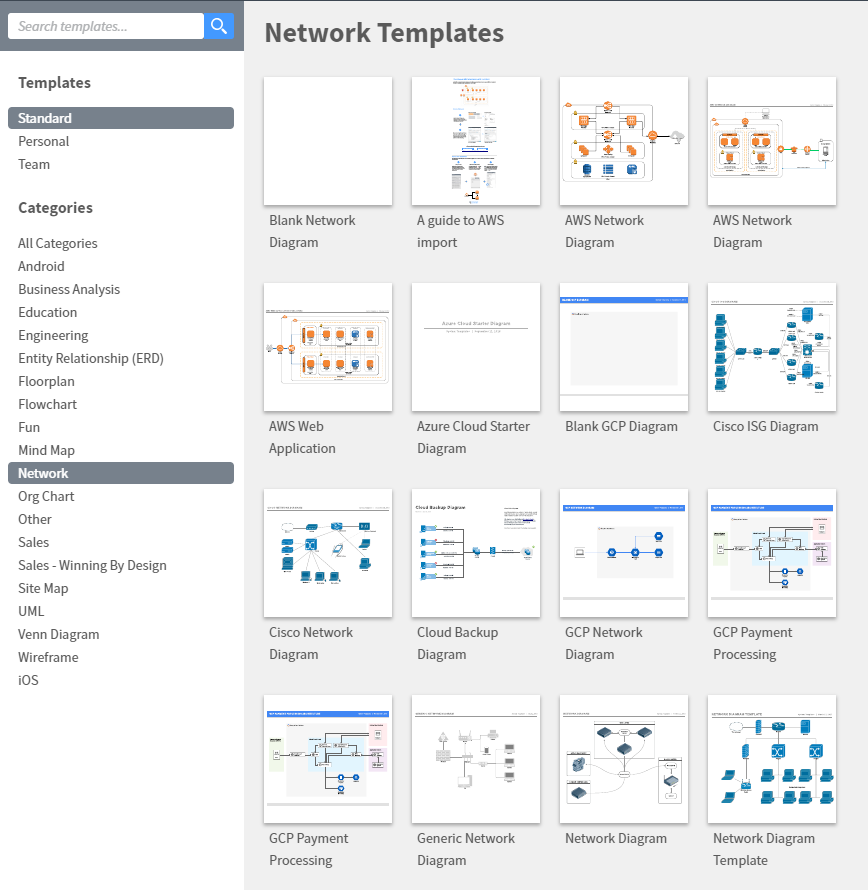
Since I installed the AWS integration I’m going to build a network diagram of my AWS account(s) by selecting the AWS Network Diagram template which is found under the “Network” category.
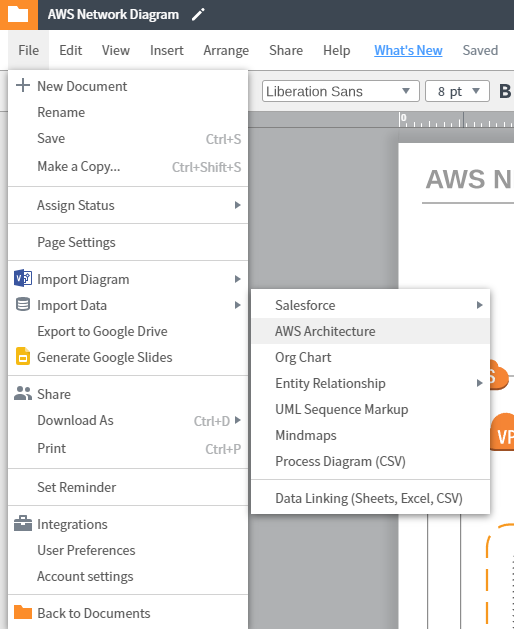
Once your new template is open, go to File –> Import Diagram and then choose AWS Architecture.
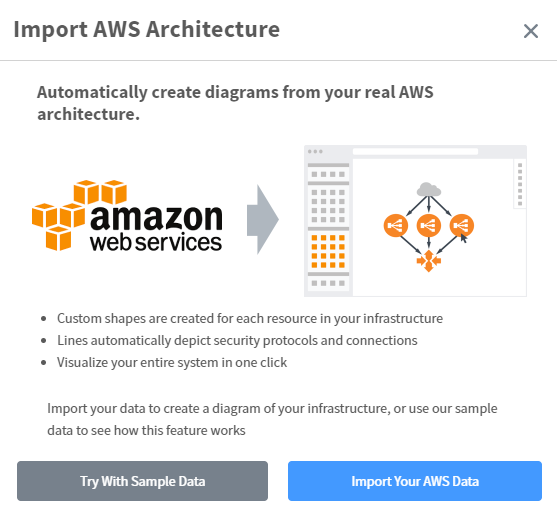
On the import AWS Architecture screen that opens, you’ll want to click the option to import your AWS Data, or if you just want to see a sample, choose the sample data to give you an idea of what it might be able to display.
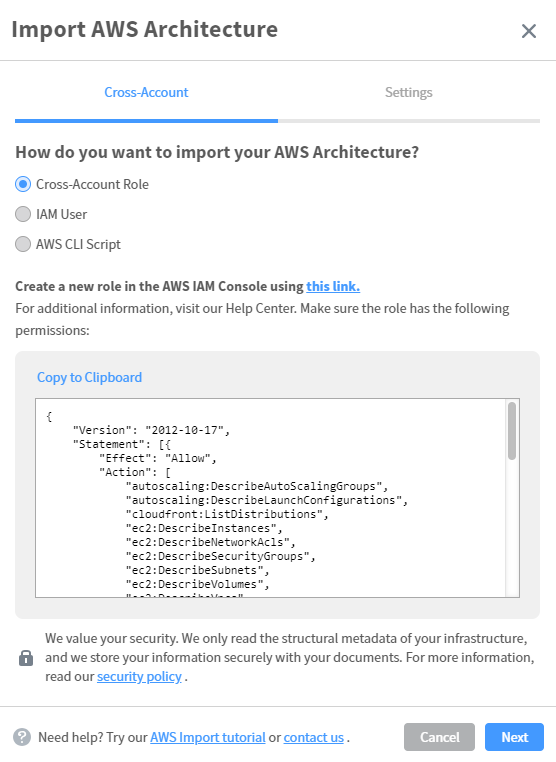
Next, you’ll need to give Lucidchart permissions to read data from your AWS account. As you can see there are several ways to accomplish this including the preferred method of using a Cross-Account Role. This screen will show you the permissions needed and generate the policy code to deploy these permissions in your AWS account. At this point you should go setup this Cross-Account Role in your AWS environment based on the instructions from Lucidchart.
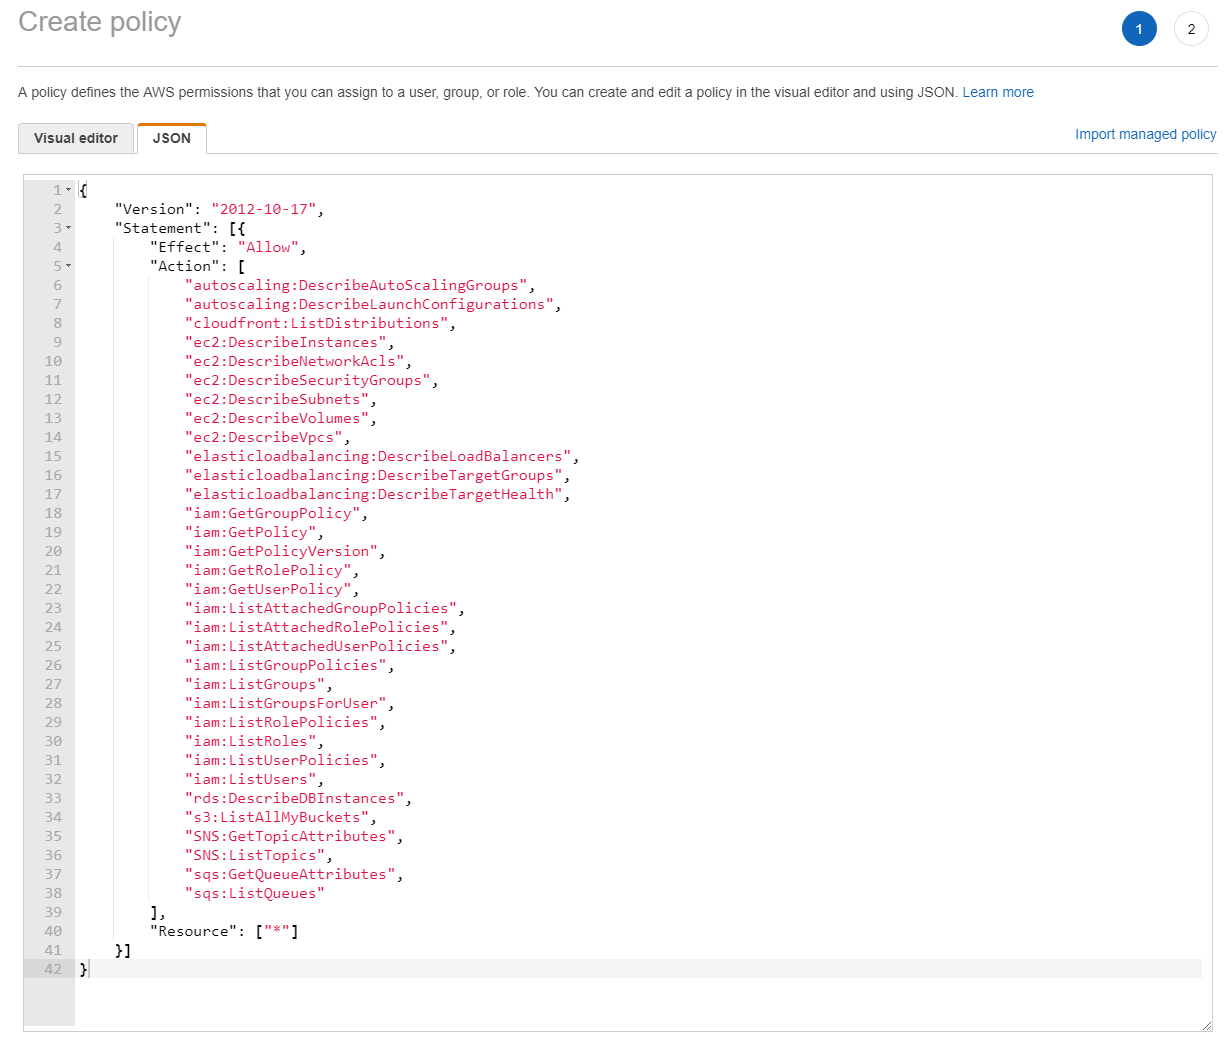
The role permissions can be directly copied and pasted into the JSON tab in the AWS IAM console to make setting up the IAM role a quick and easy procedure.
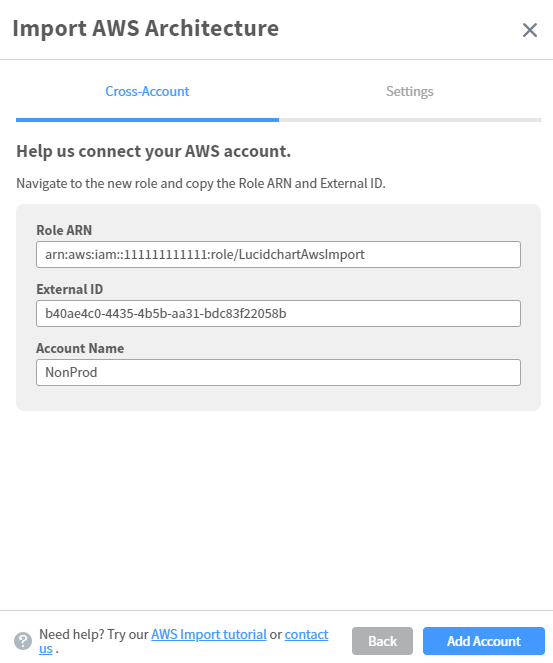
When you’re done, you’ll need to enter the Role ARN that you created and an account name for description purposes.
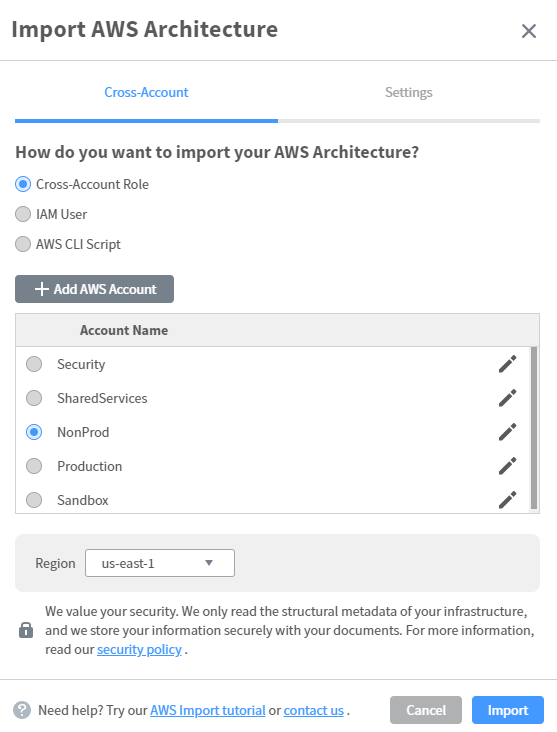
You can perform this Cross-Account role task several times so that you can add multiple accounts to your LucidChart portal. You only need to complete this one time (per account) and the credentials can be reused. This is particularly handy if you want to periodically refresh your network diagrams. You can see frommy screenshot below that I’ve added five AWS accounts to my Lucidchart portal. Now, when you’re ready to build a diagram, select the account you want to connect to and then the region from the drop down.
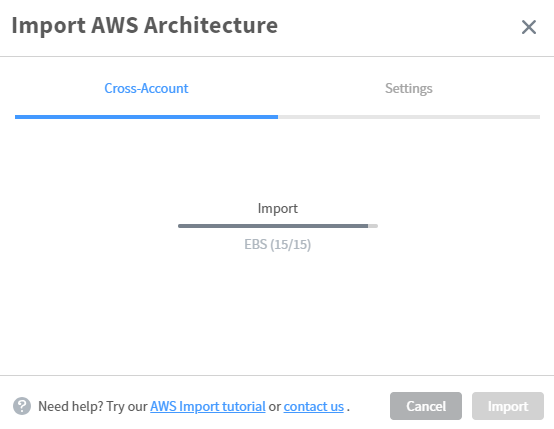
The import process will begin and you’ll see a progress bar.
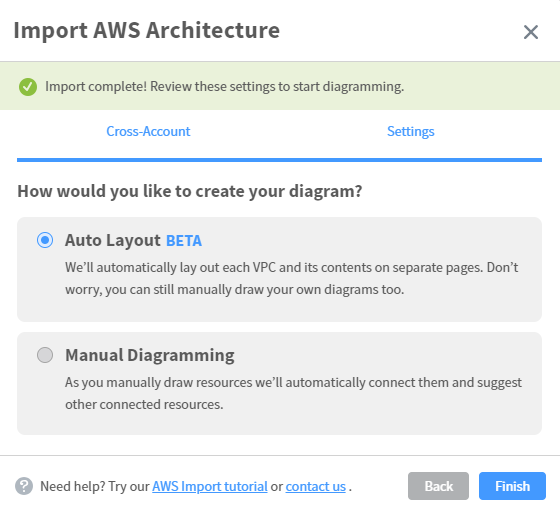
When the import is completed, you can then select how you want them to be diagrammed. I chose the “Auto Layout” so that it creates the relationships for my automatically.
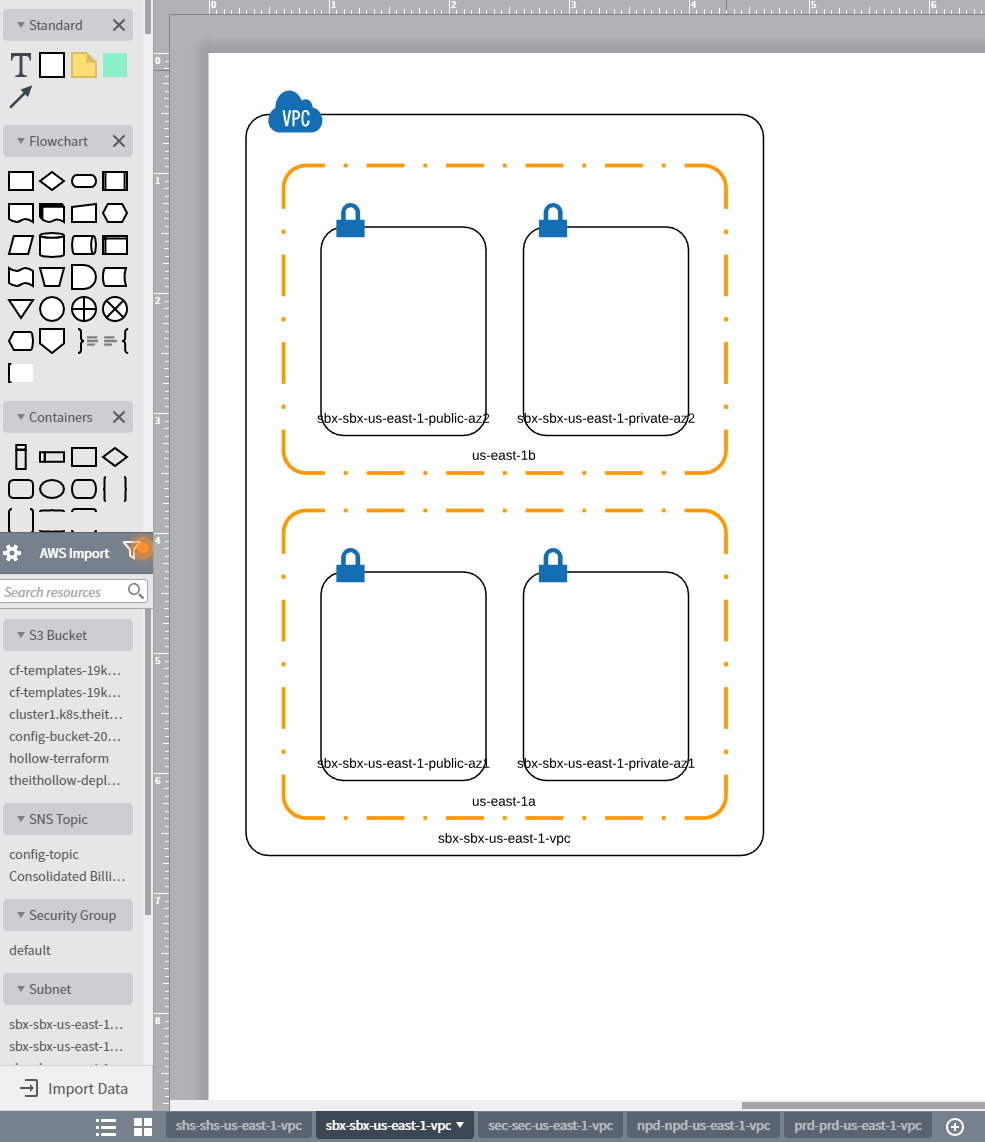
The result is that my AWS VPCs, subnets, Availability zones, etc are all diagrammed for me including the name tags I’ve configured. This is a really simple diagram since my account is mostly a landing zone for new workloads to test out, but if you had more complicated networking in place you might see additional resources listed. If you’re looking really close at the picture below, you can see that I added tabs and re-did this process for each of my accounts, giving me a full view of my AWS account network infrastructure.
Summary
If you haven’t tried Lucidchart’s integrations, you might want to jump on and give it a whirl. It’s really nice to have some of these diagrams built for you automatically because it may very well point out things you didn’t realize were in your environment. Building a Visio diagram manually will show you exactly what you “think” the environment looks like. Having an integration like this may point out some things to you as well as being great for cutting down on your time documenting. If you also use multiple operating systems like I do, having a browser based diagramming tool is an added bonus.