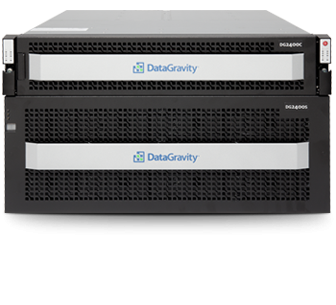
The Array
I know what you’re thinking, show me the product! What does it look like, how big is it.
- 4U storage shelf
- 2U Storage Controller (dual controllers)
- CIFSNFSiSCSI
- 48TB or 96 TB with additional 2.4TB or 4.8 TB SSD
- Homemade RAID that allows for 2 disk failures on the same storage pool
Recovery
Something out of the norm with DataGravity’s array is that they use a completely separate set of disks for snapshots. Disks are automatically assigned to different pools are nothing is required from the Administrator to set this up. This diverges from what the rest of the industry is typically does. There are two schools of thought here though:
- If you split your disks up, you can ensure that losing physical disks doesn’t mean you also lost your backups. A good rule of thumb is to not store your backups on the same physical disks that you have your data on because a failure could cause you to lose both.
- If you split up your disks, you are using less spindles to provide performance for the array. Generally more spindles means better performance.
I don’t want to suggest that one method is better than the other, but this is something you’d want to consider when purchasing an array. This decision is something that could set DataGravity apart from their competitors.
Analytics
The thing that really sets this array apart from other storage devices is it’s powerful analytics engine. The DataGravity array has two controllers but only one of the controllers actively manages storage IO traffic. The second controller is used for the analytics of the data that is on the array. The idea here is that the analytics is offloaded so as not to affect the storage IO. The second thing is that since DataGravity uses a different set of disks for data backups, the Analytics controller can run it’s processing against those disks which will also prevent the engine from impacting the disks that are being used for IO processes.
The analytics engine allows you to see file level information which is an amazing tool for storage admins. The file statistics can show who accessed the file, when, who wrote to it etc. This sort of analytics can even be done if the file is inside of a virtual machine’s vmdk file. From speaking with people at DataGravity, I found out that they are cracking open the virtual machine (on the backup disks, not production) and reading the info into the analytics engine.
Obviously, you can see how the auditing analytics could be great for a storage or security admin, but this analytics goes much deeper. It will allow you to see trends on types of files, or even cooler, the number of IOPS by file name! If you’re having a storage issue, wouldn’t it be awesome to find out which file is causing all of the IO, even if that file is inside of a virtual machine vmdk?
So, you might be asking how much the analytics engine costs. Well, the answer is it’s included with the array. The CEO, Paula Long, stated at Tech Field Day eXtra 2014, “You bought the array, you should know what’s on it.”
Summary
DataGravity seems to have a neat place in the storage industry. The belief that “You bought the storage array; you should be able to see what’s on it” is a core fundamental differentiator of this array from others. I can see amazing use cases for this type of array within corporations that need to be able to manage highly sensitive data. This could be an amazing tool for smaller organizations that don’t have large enough teams to do their own analytics or have their own storage teams. It’s easy to use and easy to manage with great insight into the underlying data.

