Any system that’s going to be deployed for the enterprise needs to have at least a basic level of monitoring in place to manage it. Kubernetes is no exception to this rule. When we, as a community, underwent the shift from physical servers to virtual infrastructure, we didn’t ignore the new VMs and just keep monitoring the hardware, we had to come up with new products to monitor our infrastructure. Sysdig is building these new solutions for the Kubernetes world.
I tried out the solution with their free 14 day free trial and it seems pretty great. Sysdig runs a SaaS platform where you login to see your metrics that are sent to the service via their agents which are installed in your Kubernetes nodes. To get started on your own, you can visit Sysdig.com to setup your own account.
I won’t take you through the installation process which includes deploying agents to your Kubernetes nodes and authenticating them with the portal, but when you setup your account the wizard will take you through a few steps and point you to the installation documentation.
Once you’re set up, you should start to see some metrics in your Sysdig Monitor dashboards.
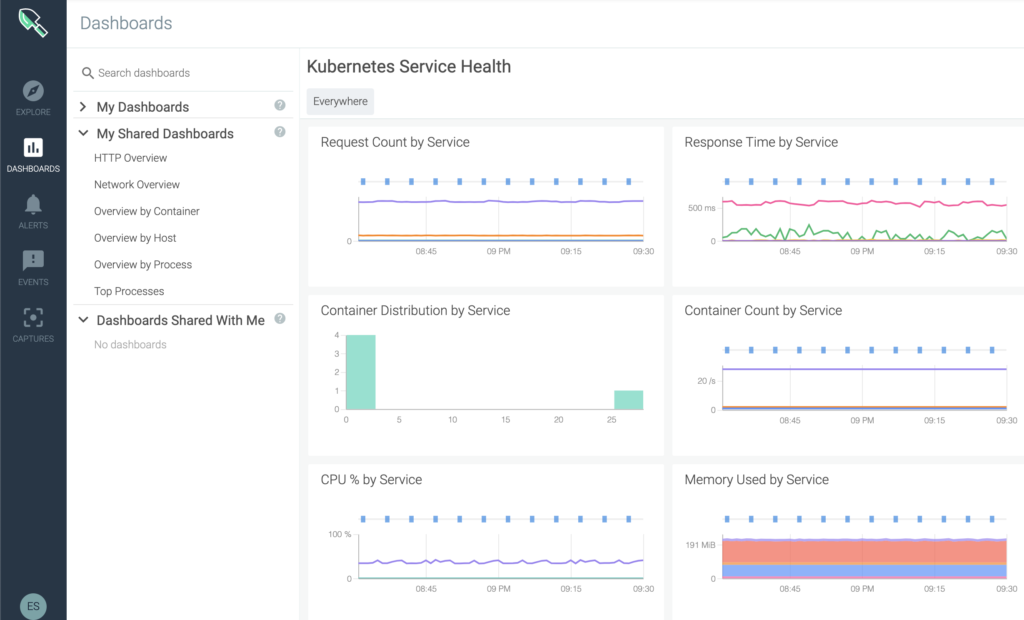
Now, this is usually the time I freak out, when all the things that I might need to be paying attention to, rush through my mind. But Sysdig is giving me nice graphs about a lot of metrics I’d commonly need to be watching in my Kubernetes cluster so my containers are healthy.
One of the things I immediately noticed is that if I move my mouse curser over any of the graphs, a pop out window shows me more details, and the time that I’ve selected lines up for all the graphs, so if I’m correlating items, I can easily see whats happening at the same time in different metrics.
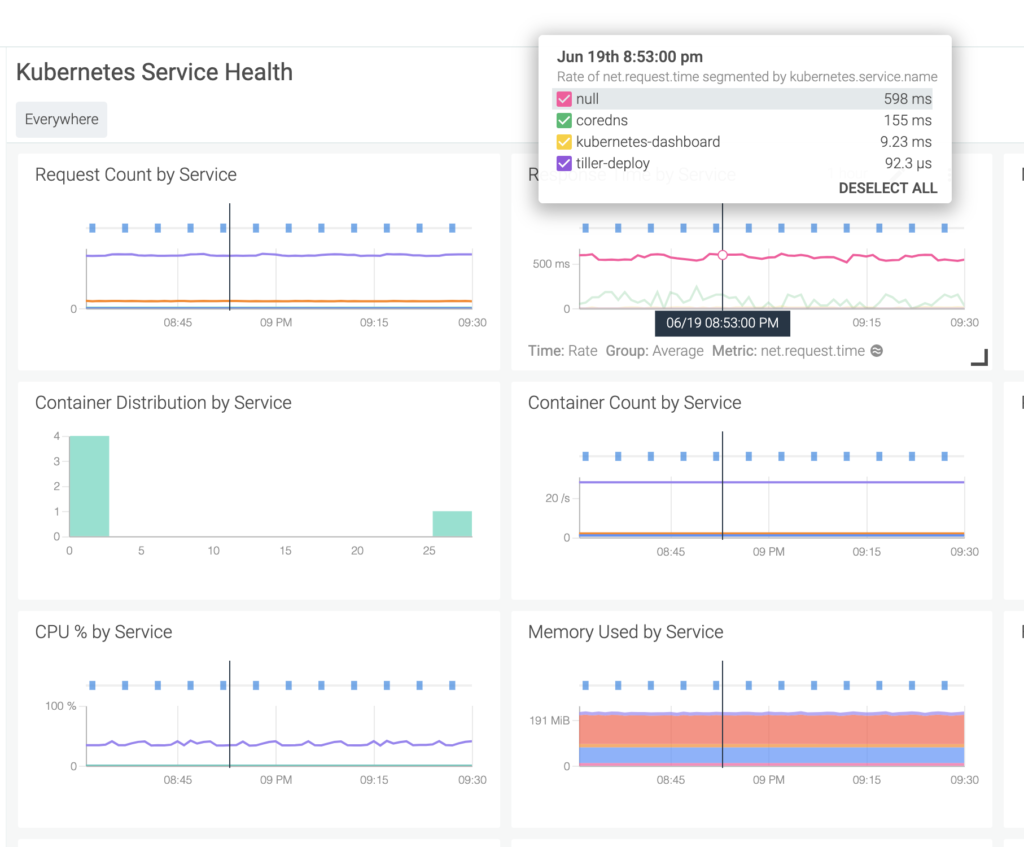
Cool, we can see pretty graphs about utilization which will really help us in troubleshooting, and in resource management in general, but what about alerting us about issues? Of course we can do that.

There are plenty of alerts that you can configure from the console. Many of which you just need to turn on, but you can also modify the alerts to your liking so that you don’t get spammed with emails… or slack messages!
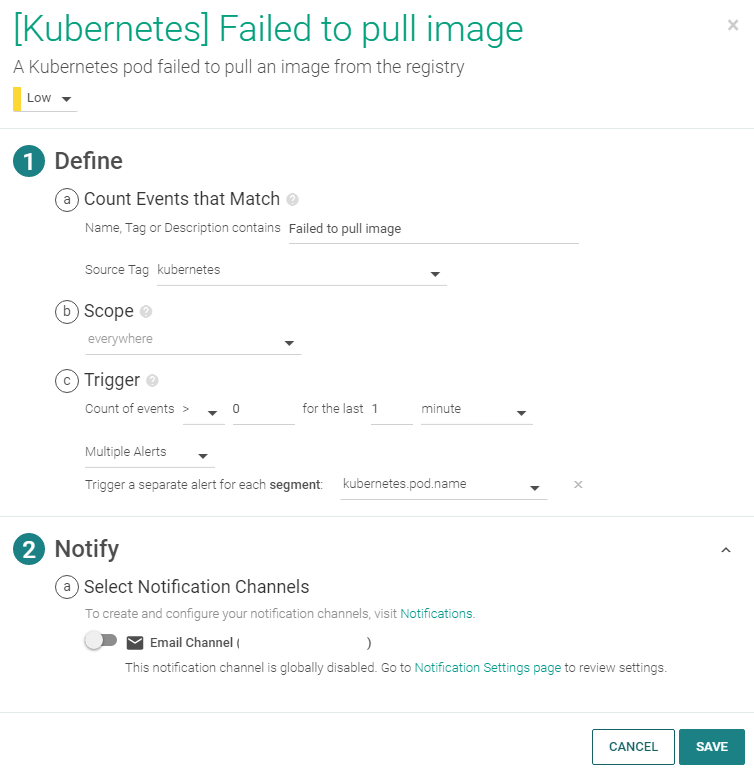
Whoa whoa whoa, wait a second! Did he just say Slack messages? Thats right, Sysdig can configure your alerts to send message to a slack channel if you prefer that method. (Email’s dead right?) As you can tell from the screenshot below, you can actually configure your alerts to go to many locations including AWS SNS, PagerDuty, etc.
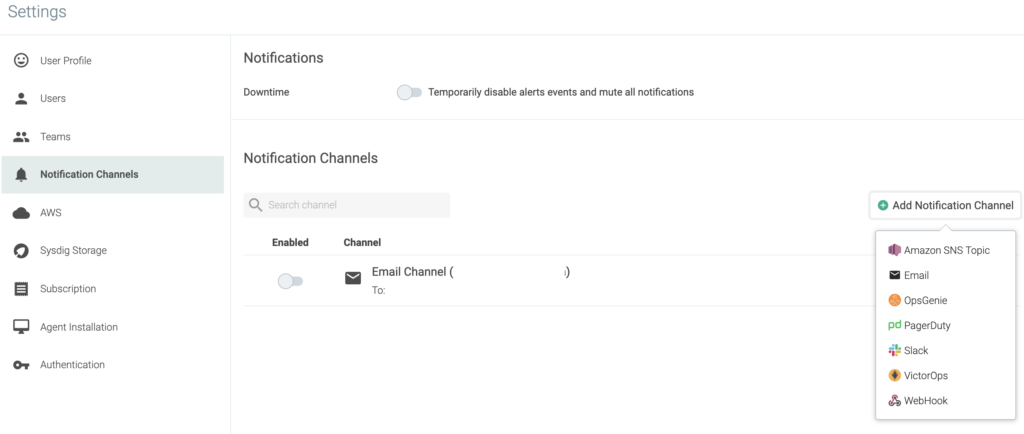
Configure your alerts that meet your requirements and sit back and watch your Kubernetes cluster cruise along, knowing that it’s all under control. Yeah, we know its harder than that, but it does make us feel better to see whats going on and know we’ll get a message when we’re not paying attention right?
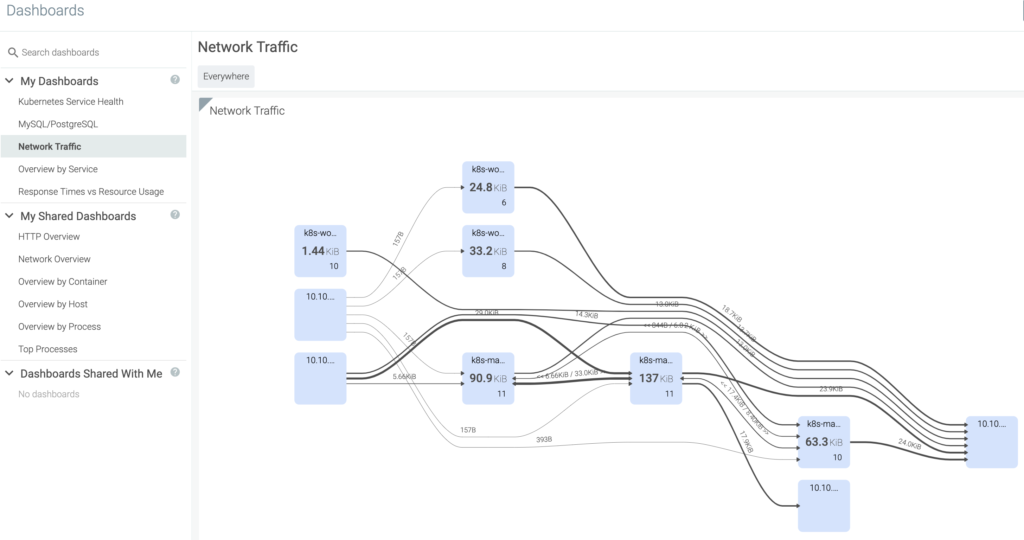
OK, before we sign off, I wanted to show one more custom dashboard that I was able to very quickly create to show network traffic between my linux nodes. I don’t know why but staring at these network maps just gives me a good feeling. As with all these dashboards, you can edit the scope to narrow down the time the metrics are displaying. This is really a must with this much data. Narrowing down the scope to a time when you know events happened, is a really important feature for troubleshooting issues.
Summary
Sysdig is doing some pretty cool stuff with monitoring and thats good news because we need some good tools to monitor our new container infrastructure. There is a lot more that they are doing such as with their “Secure” product for auditing and compliance which I didn’t talk about in this post. If you want the real low-down on what Sysdig’s up to, go check out a trial for yourself or contact a sales rep. Have fun!