With all of the services that Amazon has to offer, it can sometimes be difficult to manage your cloud environment. Face it, you need to manage multiple regions, users, storage buckets, accounts, instances and the list just keeps going on. Well the fact that the environment can be so vast might make it difficult to notice if something nefarious is going on in your cloud. Think of it this way, if a new EC2 instance was deployed in one of your most used regions, you might see it and wonder what it was, but if that instance (or 50 instances) was deployed in a region that you never login to, would you notice that?
To mitigate against issues like this we use the AWS CloudTrail service which can log any console or API request and store those logs in S3. It can also push these logs to Amazon CloudWatch Logs which allows us to do some filtering on those logs for specific events.
This post assumes that you’ve already setup CloudTrail to push new log entries to CloudWatch Logs. Once that’s setup we’re going to go through an example to alert us whenever a new IAM user account is created by someone other than our administrator.
Create a Metric Filter on the CloudTrail Logs
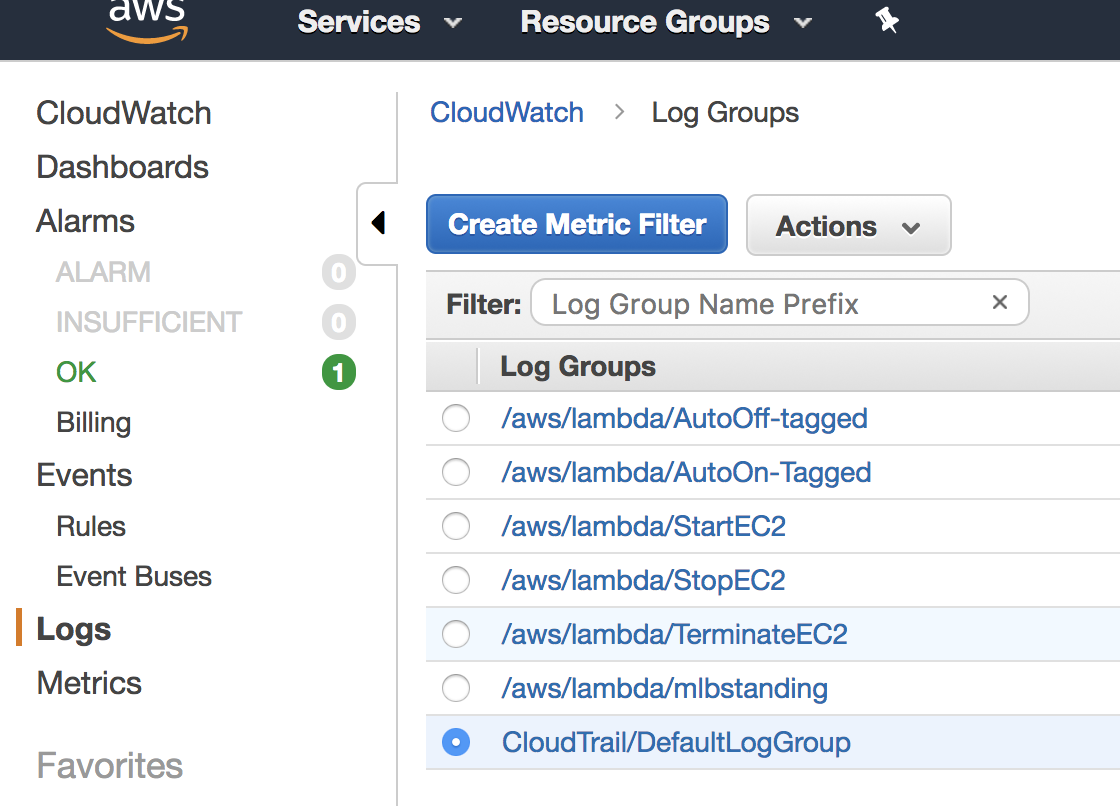
Login to the AWS console and navigate to the CloudWatch Service. Once you’re in the CloudWatch console go to Logs in the menu and then highlight the CloudTrail log group. After that you can click the “Create Metric Filter” button.
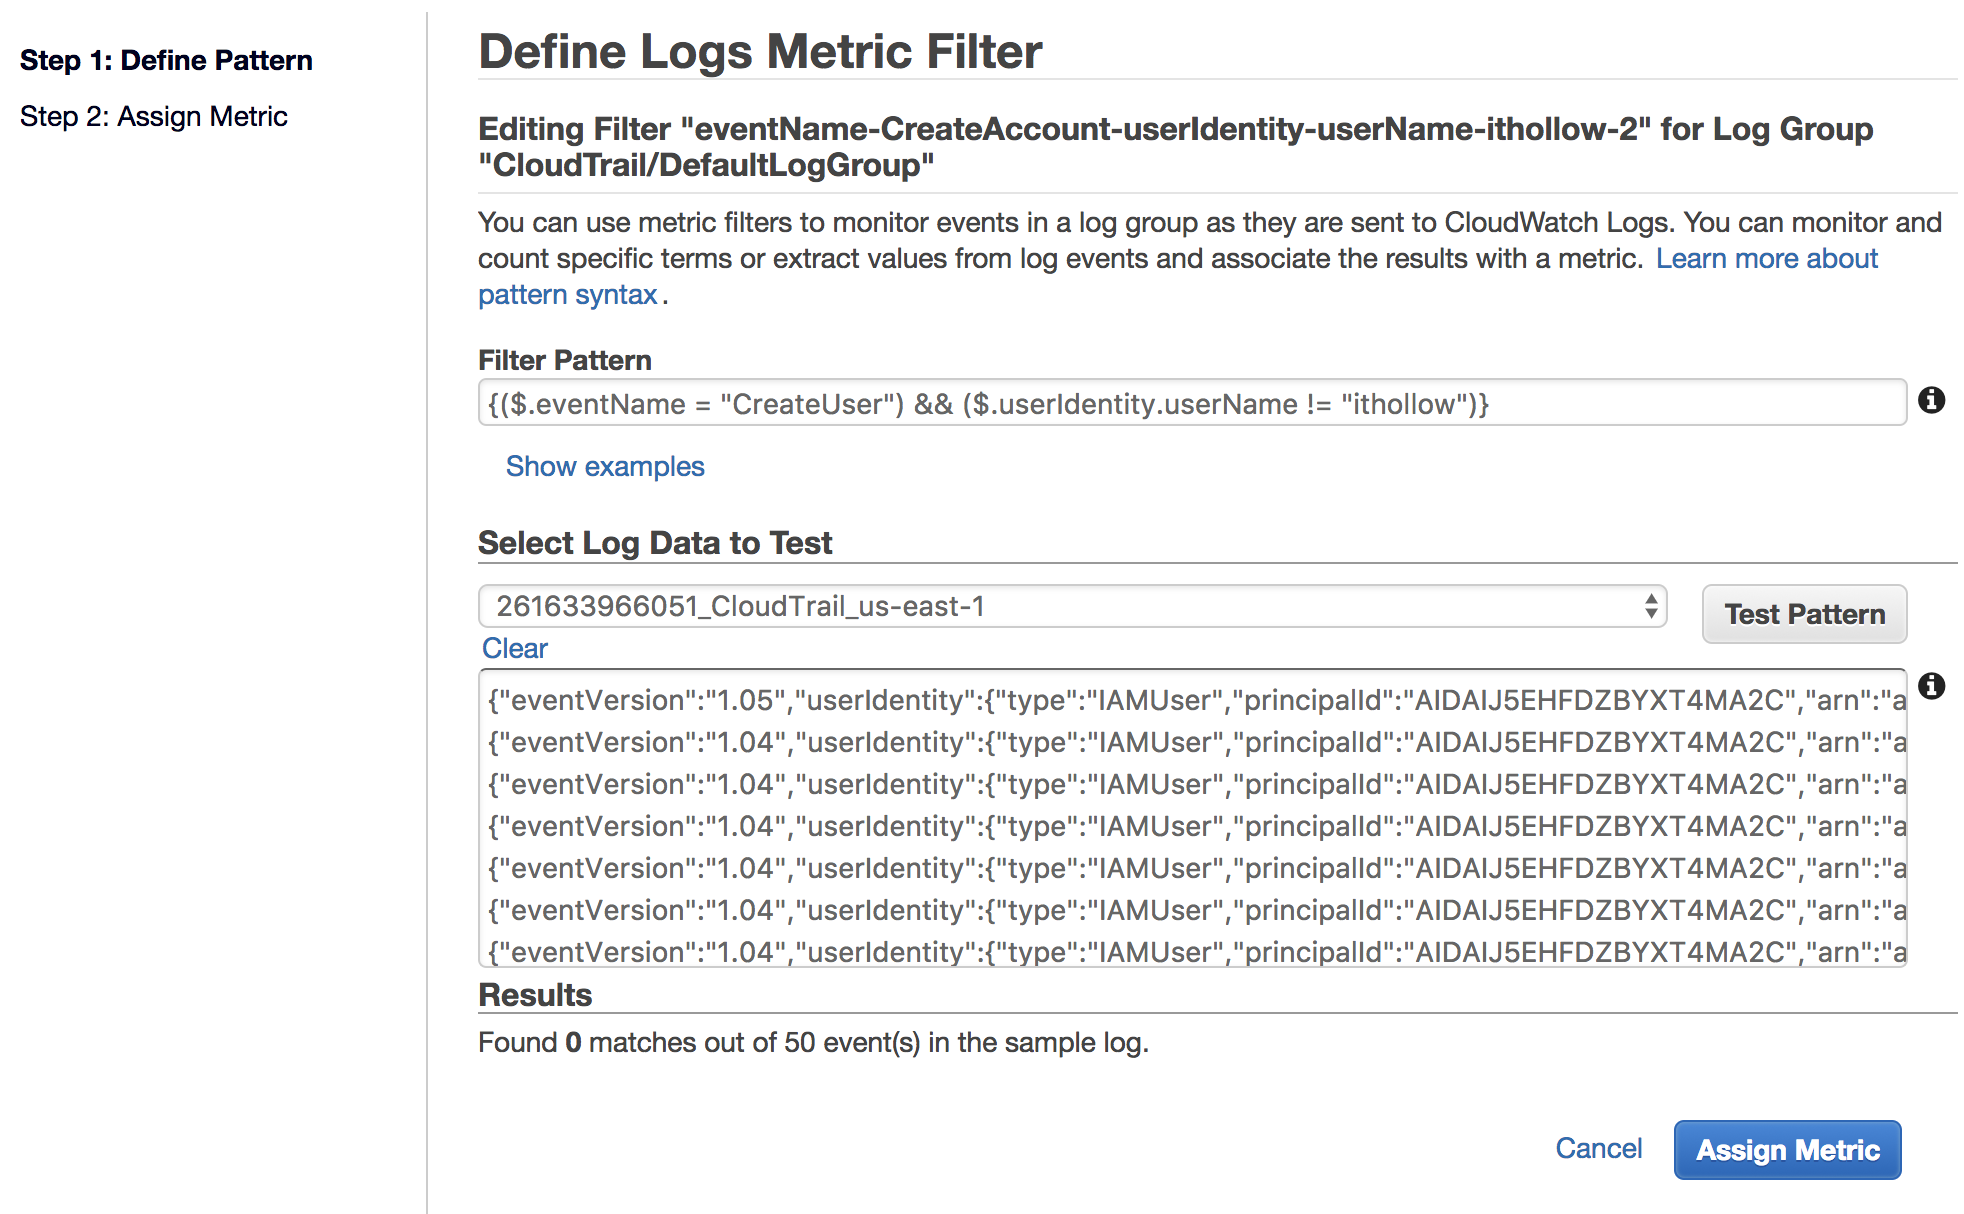
In the “Filter Pattern” box we’ll select a pattern that we’re looking for. In my case I want to filter out any events where a new user account is created and the user who did it is not “ithollow”. To do that we need to use the Filter and Pattern Syntax found below.
{($.eventName = "CreateUser") && ($.userIdentity.userName != "ithollow")}
You can test the results of your filter pattern agains some of your existing logs to see what is returned. In my case I got no results because I don’t have any events like that yet in my logs. When you’re ready click the “Assign Metric” button.
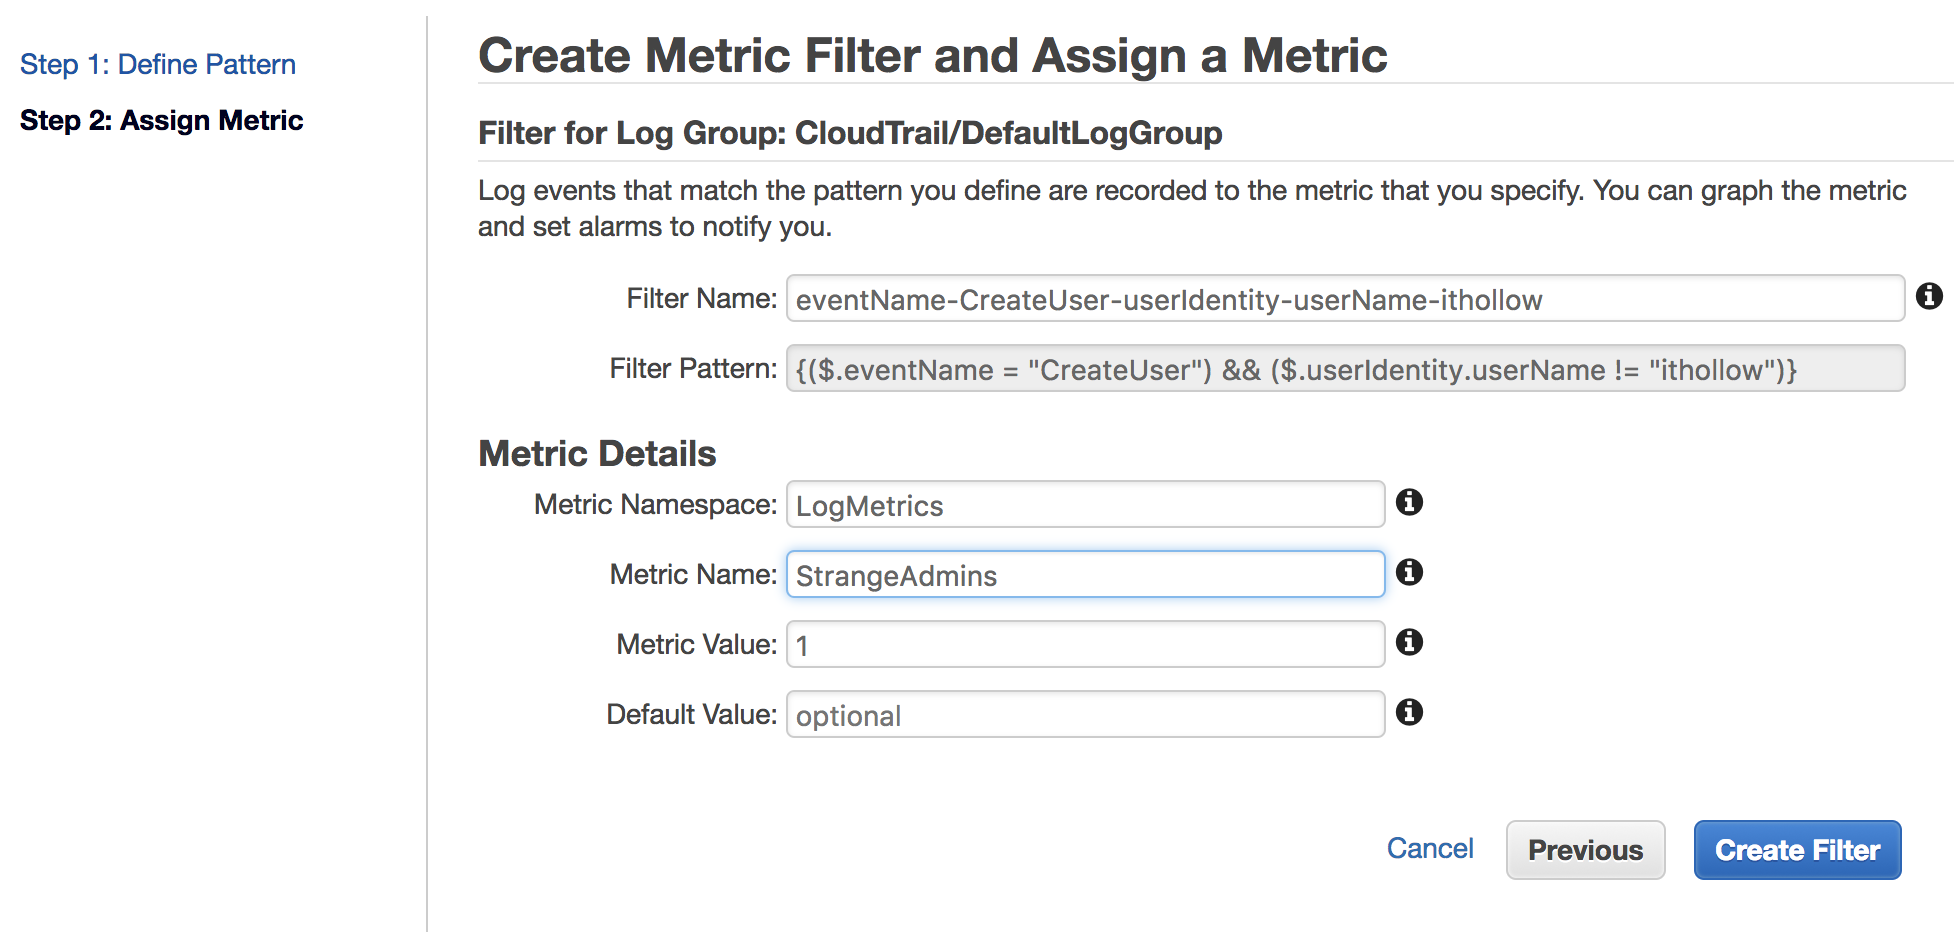
Now you can leave the filter name as is, or use your own custom naming. Under the Metric Details a namespace will be added for use in the event that multiple logs have filters on them. And you can give the metric a name there as well. I’ve left the rest of the values as defaults. Click the “Create Filter” button.
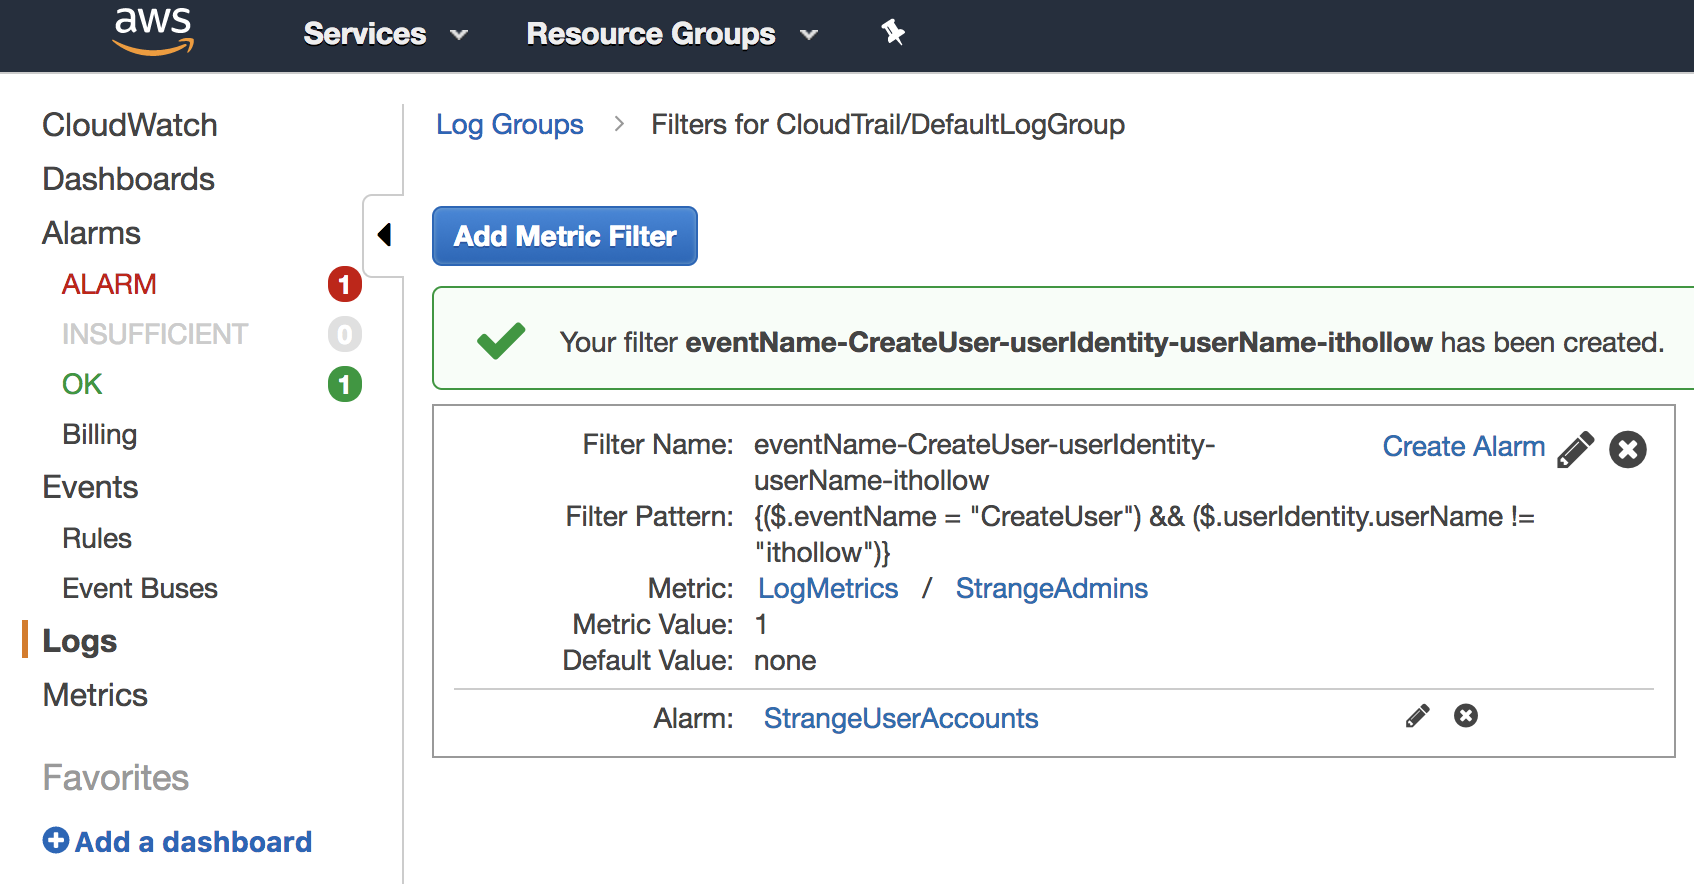
You should be taken back to the CloudWatch Console and see that a new filter has been created.
Create an Alarm
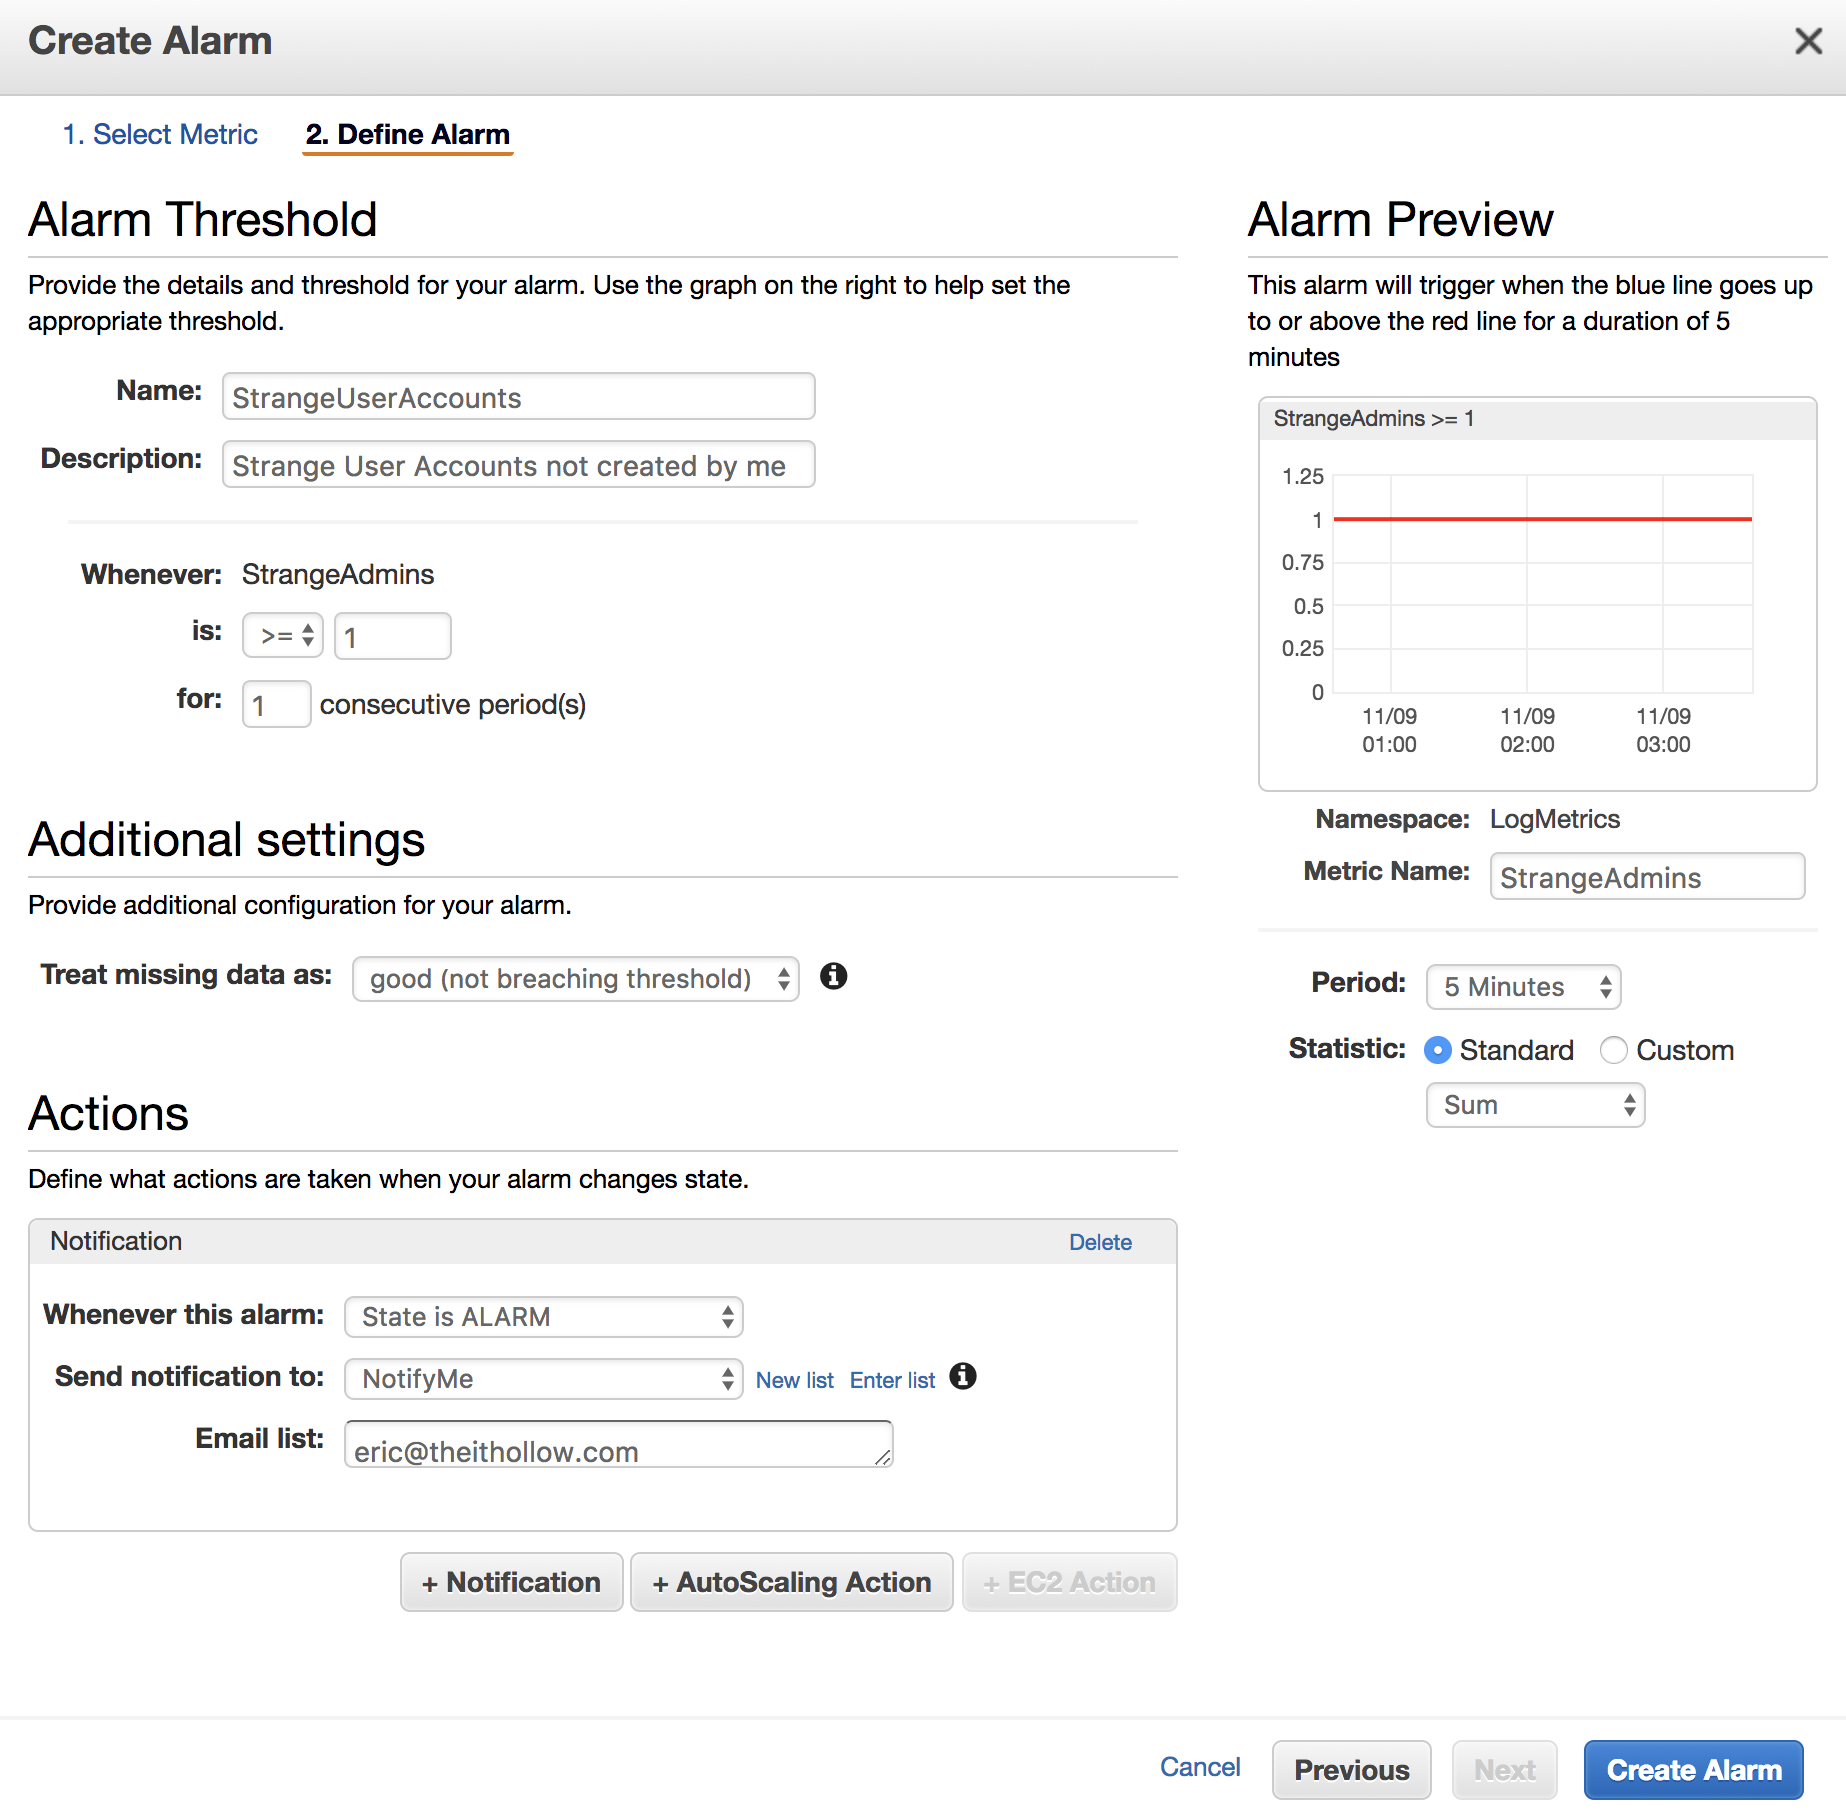
Now that we’ve created a way to filter our logs. Lets add an alarm to notify us when these events have occurred. On the logs screen from above, click the “Create Alarm” link next to your filter. Give the alarm a name and description for easy identification later. Then set the threshold values. I’ve said, anytime this event happens more than or equal to 1 time for a single period, trigger the alarm. I also changed the setting to treat missing data as good, otherwise I will have an alarm with “insufficient data” in it all the time until one of these weird accounts shows up. So, no news is good news, in my scenario.
Lastly, under the actions section, I’ve selected my “NotifyMe” SNS topic so that it will email me when this happens.
Testing
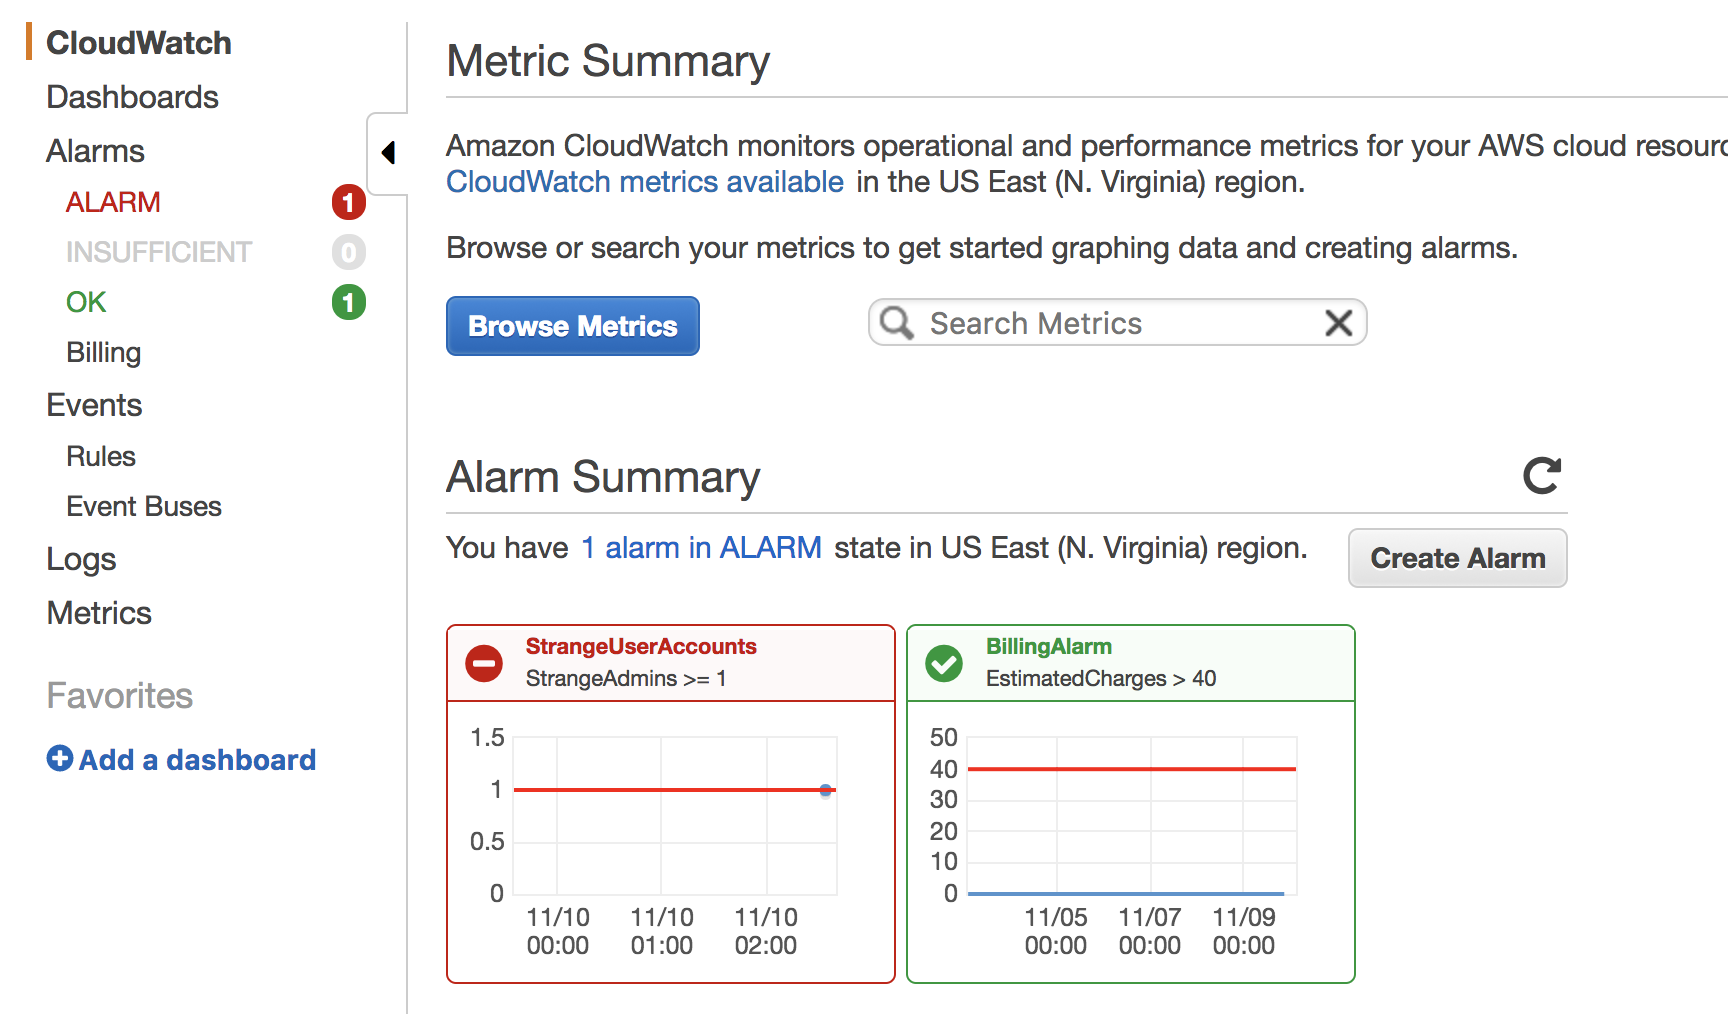
Now that our alarms are created and metric filters configured, lets test it. I logged into the AWS account with a user that had Admin permissions that wasn’t me and created a new user. Shortly after creating the user the CloudWatch console showed an alarm and the “StrangeUserAccounts” alarm went off.
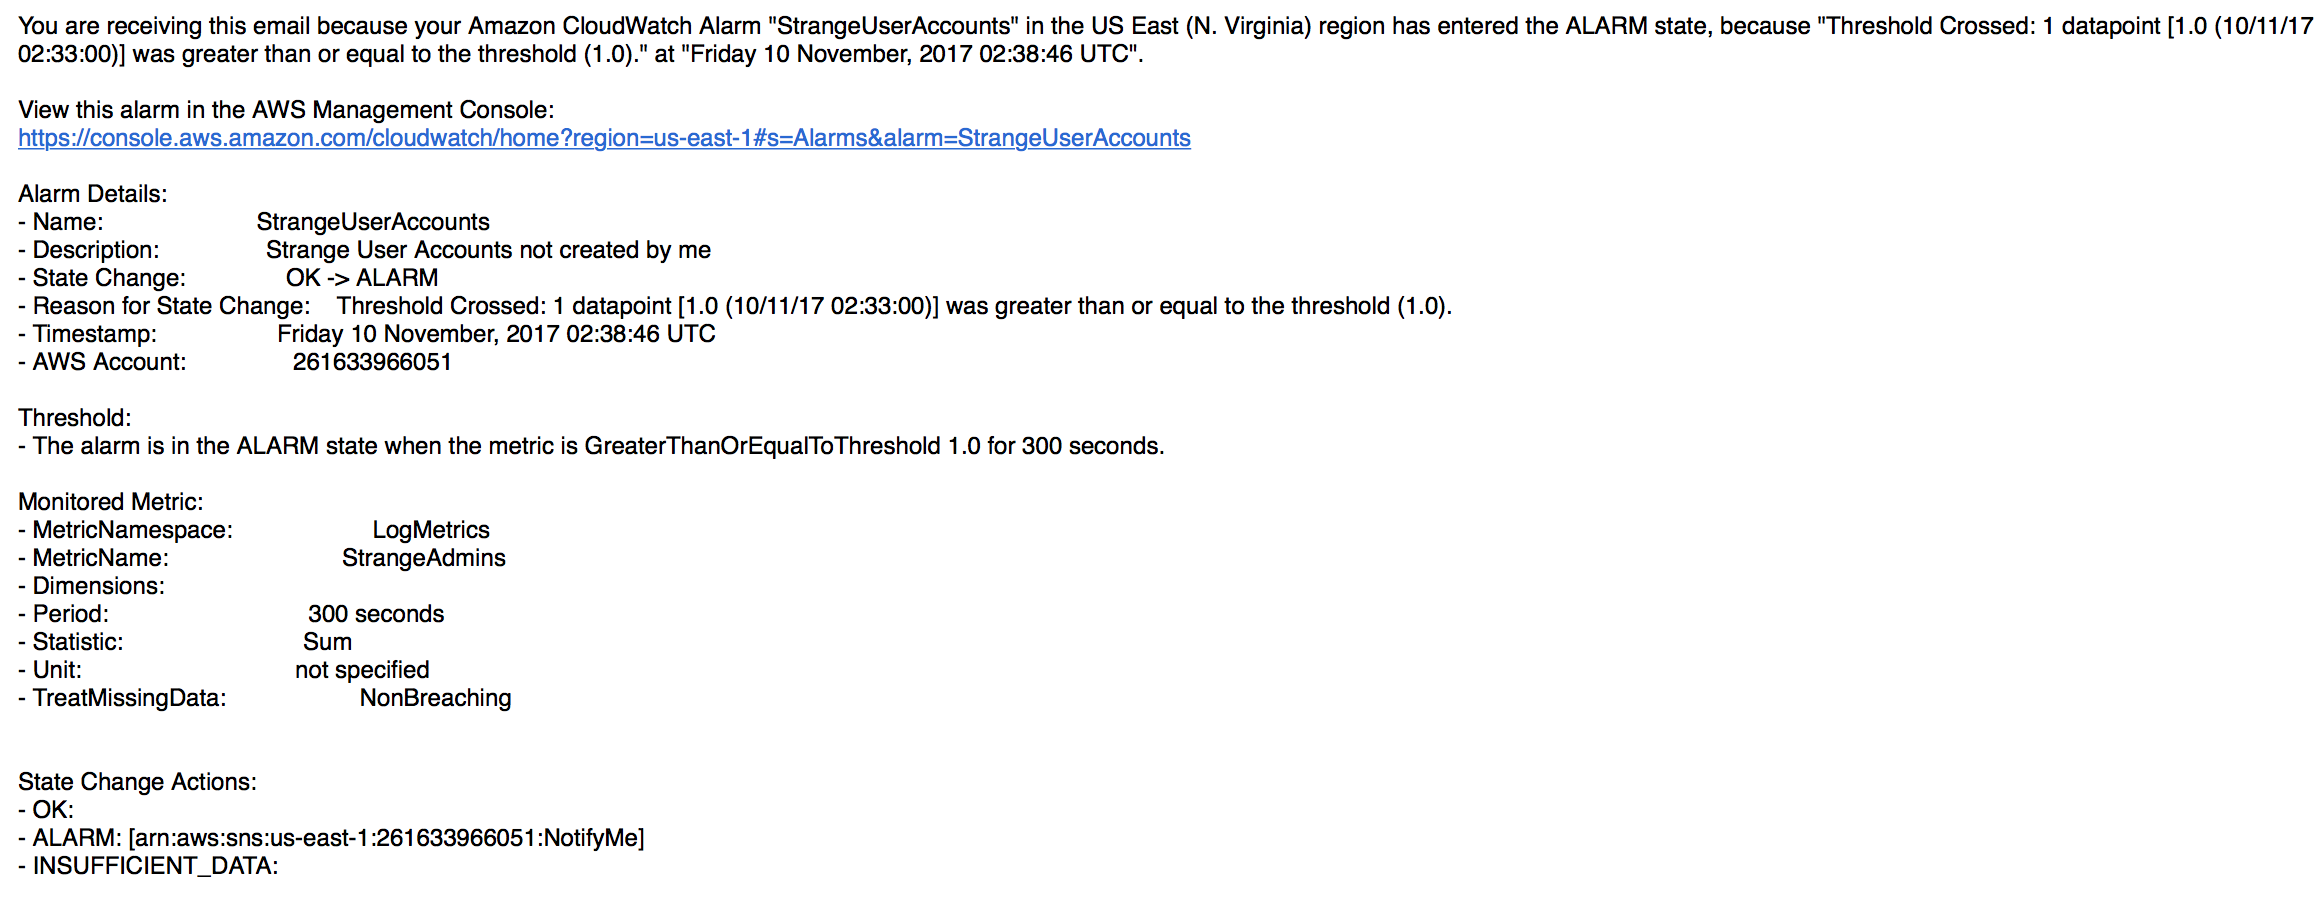
My SNS notification came through email and you can see that email in the screenshot below with the details.
Summary
This was a pretty basic example, but using CloudWatch Logs with metric filters and alarms can really help you keep you a close eye on your environment. Think of all the ways you can use CloudWatch Logs to send alerts about things in your environment that you care about.
